In this article8 sections
Data has value only when it improves decisions
Most companies already have a large amount of data. Sales has CRM records, finance has reports, operations has spreadsheets, support has tickets and marketing has campaign metrics. Still, more data does not automatically mean better decisions. Very often, it means more files, more versions of the truth and more time spent explaining what actually happened.
Business analytics for management becomes valuable when it turns data into clear insights, priorities and decisions. It is not just a technical BI report. It is a way for leadership to see what is happening, where performance is changing and where action is needed before the issue becomes larger.
In practice, the main problem is rarely the absence of data. The problem is that data is scattered, inconsistent, late or not translated into the language of management decisions. Leaders do not need another spreadsheet. They need a reliable system that shows what matters, why it matters and what the next reasonable step should be.
Why traditional reports often fail to change decisions
Traditional reports often arrive too late. When management receives data at the end of the month, many important decisions should already have been made. The problem becomes bigger when every department uses its own report, its own definitions and its own interpretation.
Another issue is too much detail without hierarchy. A report may contain many charts and tables, but if it does not show what is abnormal, where the risk is and what requires attention, it does not support decision-making. Management then has to manually search for a signal in a lot of noise.
The third problem is that reports are often separated from processes. If revenue is dropping, but the report does not connect that drop with pipeline quality, follow-up speed, stock availability or sales activity, the conclusion may be fast but wrong.
What useful analytics must show
Good analytics does not try to show everything. It helps management see what is important for the company goals. The most useful questions are: what is happening, why is it happening, what may happen if we do not react and which decision can create the strongest business effect.
That is why a BI platform should be connected to business goals, not only to available data. If the goal is sales growth, analytics should connect pipeline, conversion rates, opportunity value, sales activity and collection. If the goal is better support efficiency, it should track response time, repeated requests, escalations and customer experience.
Analytics becomes useful when management sees the relationship between activity and outcome. Decisions are no longer based only on feeling, but on a clearer picture of how the business actually works.
How data becomes a decision
The first step is to define the decisions that management actually makes. Before building a dashboard, the company should ask which decisions are repeated every week or month, where visibility is weak and where a wrong decision creates the greatest cost.
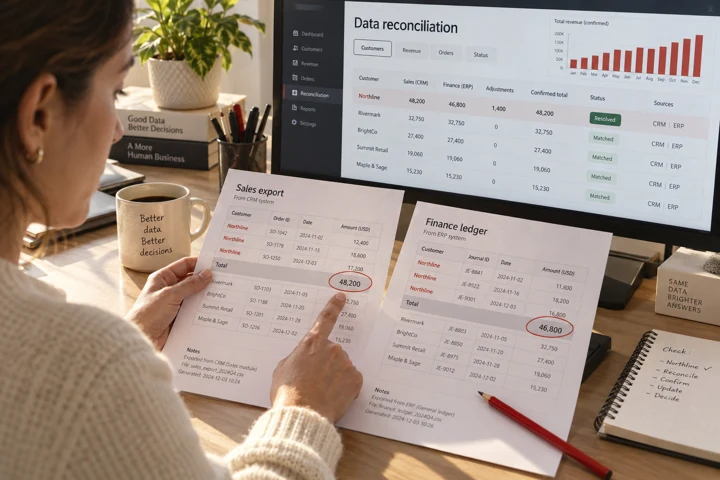
The second step is agreeing on one version of the truth. If sales, finance and operations calculate the same metric differently, analytics will only transfer the conflict into a nicer visual format. Data sources, calculation rules, ownership and update rhythm must be clear.
The third step is connecting analytics with action. If the dashboard shows a problem, someone must know who reacts, within which timeframe and through which process. Without that, analytics becomes a screen people look at, but do not use to change behavior.
Sales as a system, not just a result
If management tracks only total revenue, it sees the consequence. If it tracks pipeline, new opportunities, sales stages, closing time, lost opportunities and follow-up quality, it sees causes. This difference changes the quality of decisions.
A drop in revenue does not necessarily mean that the market has stopped. It may mean that fewer opportunities entered the pipeline two months earlier, follow-up is late, offers wait too long for approval or the team focuses on the wrong segment.
This is why management decision-making must be connected with processes and tools. Analytics should not be a separate reporting function. It should become part of how the business is managed every day.
From reporting to a management system
When designed well, business analytics is not only used for reporting. It becomes a management system. It helps leaders recognize trends, react earlier, allocate resources and check whether initiatives are producing results.
For Positive, analytics is connected with processes, software, AI and infrastructure. It is the layer that combines data from different parts of the business and turns it into an understandable view. When it is connected with ownership and processes, analytics helps the company work more calmly and precisely.
If you want management to make decisions based on reliable data, the first step is not only building a dashboard. The first step is understanding which decisions you want to improve, which data you need and who is responsible for data accuracy.
How to start without an oversized BI project
A good starting point is not trying to cover the entire company at once. It is usually better to choose one area where management currently lacks clarity. This may be sales, collection, support, projects or profitability by service. Once one area is clarified, the same method can be expanded.
In that first area, the company should define a small number of decisions it wants to improve. For example: which sales opportunities require attention, which customers are late with payment, where projects are blocked, which customer requests repeat and which costs are growing without explanation.
Only when the questions are clear should the company define indicators. This is the opposite of what often happens in practice. If the screen is designed first and purpose is added later, the dashboard will rarely become a decision-making tool.
Positive approach to business analytics
Positive sees business analytics as part of a broader system, not as an isolated reporting tool. If processes are unclear, data will often be inconsistent. If systems are disconnected, management will not have a complete view. If data ownership is not defined, trust in analytics will weaken quickly.
That is why analytics needs to be connected with business consulting, digital solutions, BI and adoption. The goal is not only to create a view, but to help the company understand which decisions it wants to improve, which data it needs to organize and how insights become action.
This approach is slower than quickly drawing charts, but it is much more useful. The company does not get only a visual display. It gets a foundation for management.