In this article9 sections
A nice screen does not mean better insight
Many companies want dashboards. This is understandable. Management wants faster visibility, less waiting for reports and a clearer picture of business performance. The problem appears when a dashboard is built as a prettier version of an existing report.
A management dashboard is not a collection of charts. Its purpose is not to display everything a system can extract, but to show what helps leadership manage the company. If a dashboard does not lead to a question, decision or action, it is only a visual report.
A good dashboard reduces the time needed to understand the situation. When a leader opens the view, it should be clear what is on track, what is changing, what requires attention and who owns the issue.
The difference between a report and a dashboard
A report usually explains what happened in a defined period. A dashboard should show what is happening now, what is changing and where attention is required. Reports are often retrospective. Dashboards should be management tools.
This does not mean reports are unnecessary. They remain useful for deeper analysis, formal documentation and financial reviews. But if every management decision depends only on static reports, the company often reacts later than it should.
A BI dashboard should connect key indicators with real business processes. Sales should include pipeline, conversion and collection. Support should include response time, open requests and escalations. A dashboard should not be isolated from work.
What management should actually track
Management should not track everything. It should track indicators that show business health, process efficiency, service quality, financial discipline and risk. These usually include growth, productivity, quality, speed, cost, risk and customer experience.
Every KPI should have a business reason. If an indicator does not influence any decision, it is fair to ask why it is on the dashboard. If no one owns it or knows what happens when it changes, it takes space without creating value.
A good management overview does not need to answer every question. It needs to show where the important questions are. Details can be opened later, but the first level must be clear.
Five rules of a useful dashboard
The first rule is focus. One dashboard should not serve everyone. CEO, sales, finance and operations dashboards have different purposes. If everything is mixed, no one gets exactly what they need.
The second rule is context. A number means little without comparison. Revenue may be good or weak depending on the plan, previous period, season and pipeline. A dashboard must show the relationship with goals and trends.
The third rule is action. Every key indicator should have an owner and a defined response when it changes. The fourth rule is simplicity. Visual complexity is not analytical depth. The fifth rule is trust in data.
Connecting dashboards with decision-making
A dashboard must be part of the management rhythm. It should be used in weekly, monthly or quarterly meetings, connected with decisions and linked to concrete activities. If it is opened only occasionally, it will not change how the company works.
A practical approach is to define three elements for every key KPI: target, reaction threshold and owner. If support response time crosses the threshold, the team knows who reacts and what is checked first.
This is when a dashboard stops being a screen and becomes a management tool. That is the difference between analytics that only informs and analytics that changes behavior.
From visibility to business control
The goal of a dashboard is not another digital display. The goal is better control over the business: less guessing, fewer late reactions and less dependence on manually prepared reports.
For Positive, dashboards are most useful when connected with processes, data and responsibilities. That is why they are not treated as isolated BI projects, but as part of broader digital transformation.
If you want a dashboard that helps management, start with the decisions you want to improve. Only then define metrics, data sources and visual design.
What a good first dashboard looks like
A good first dashboard is simple. It does not try to impress with the number of charts. It helps the user understand the situation in a few minutes. For management, the first level often needs targets, actual performance, trends, deviations and areas that require attention.
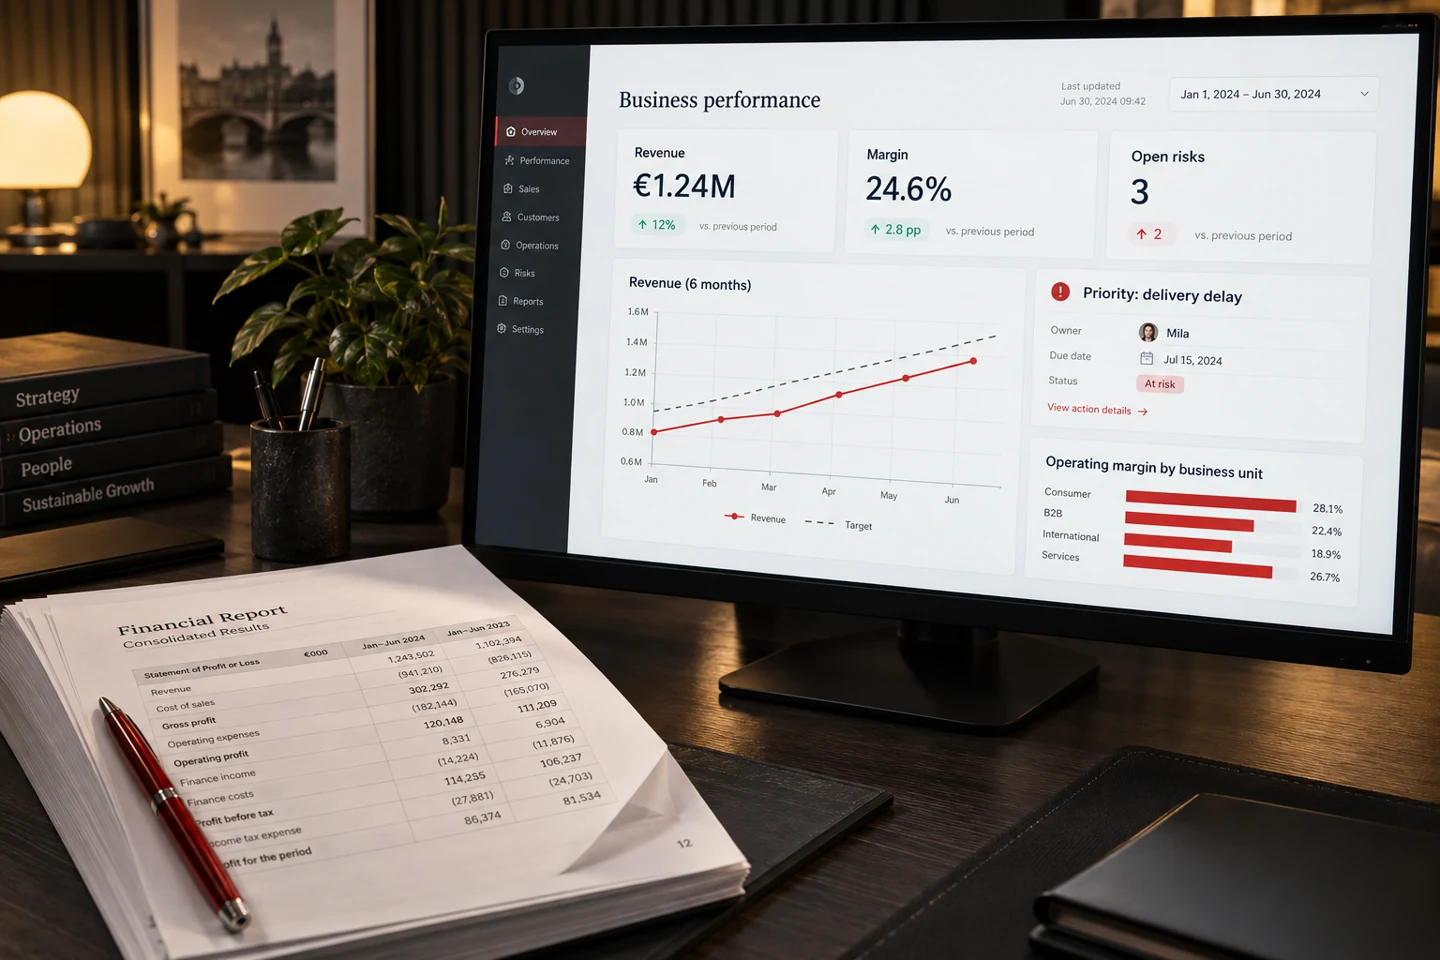
A CEO dashboard may include revenue, pipeline, collection, project delivery, operational bottlenecks and risks. A sales dashboard can go deeper into opportunities, stages and activities. An operations dashboard can track deadlines, workload and delivery quality.
The most important point is that a dashboard should not become a catalogue of everything that can be measured. If the user gets lost, the dashboard has failed. If the user quickly sees what needs attention, analytics is doing its job.
Why a dashboard needs an owner
Without ownership, a dashboard becomes outdated. Someone must be responsible for the relevance of indicators, consistency of definitions, usage and adaptation when business priorities change.
The dashboard owner does not have to be the person who technically builds the reports. It should be a business person or manager who understands what the dashboard should enable. BI or IT can support implementation, but the purpose must remain business-led.
With ownership, a dashboard becomes a living tool. Without it, it becomes a screen created once and then slowly disconnected from business reality.
Positive approach to dashboards
Positive starts with decisions, not visuals. First, the company defines who the dashboard serves, which decisions it supports, which KPIs matter and which data is reliable enough. Only then does the visual structure make sense.
This approach helps a management dashboard become more than a decorative part of digital transformation. It becomes part of the management rhythm. When connected with meetings, responsibilities and actions, the dashboard creates business value.
If the company already has reports, the first step is not always building a new dashboard. Sometimes the first step is cleaning metrics, agreeing on definitions and removing indicators that no one uses for decisions.
Related services: business consulting